
DEMOCRATIC strategist and Clinton ally James Carville famously said in the 1990s, "It's the economy, stupid."
Analysts and pundits get paid for getting people riled up by their inflammatory opinions on America's ongoing culture wars. But in the final analysis most elections generally boil down to how voters feel about their own economic status and prospects.
In today's time of nearly 10 percent inflation and high gas prices, that adage would seem to be even more applicable. The most recent Pew poll of which issues voters care most about this midterm election season shows that the vast majority rank the economy as their main concern.
But what exactly do these dire economic figures and statistics mean?
I wanted to ask the area's premier economics guru about what exactly inflation means, how it's measured, and how it might impact elections.
Dr. Michael Toma is the Fuller E. Callaway Professor of Economics at the Armstrong campus of Georgia Southern University.
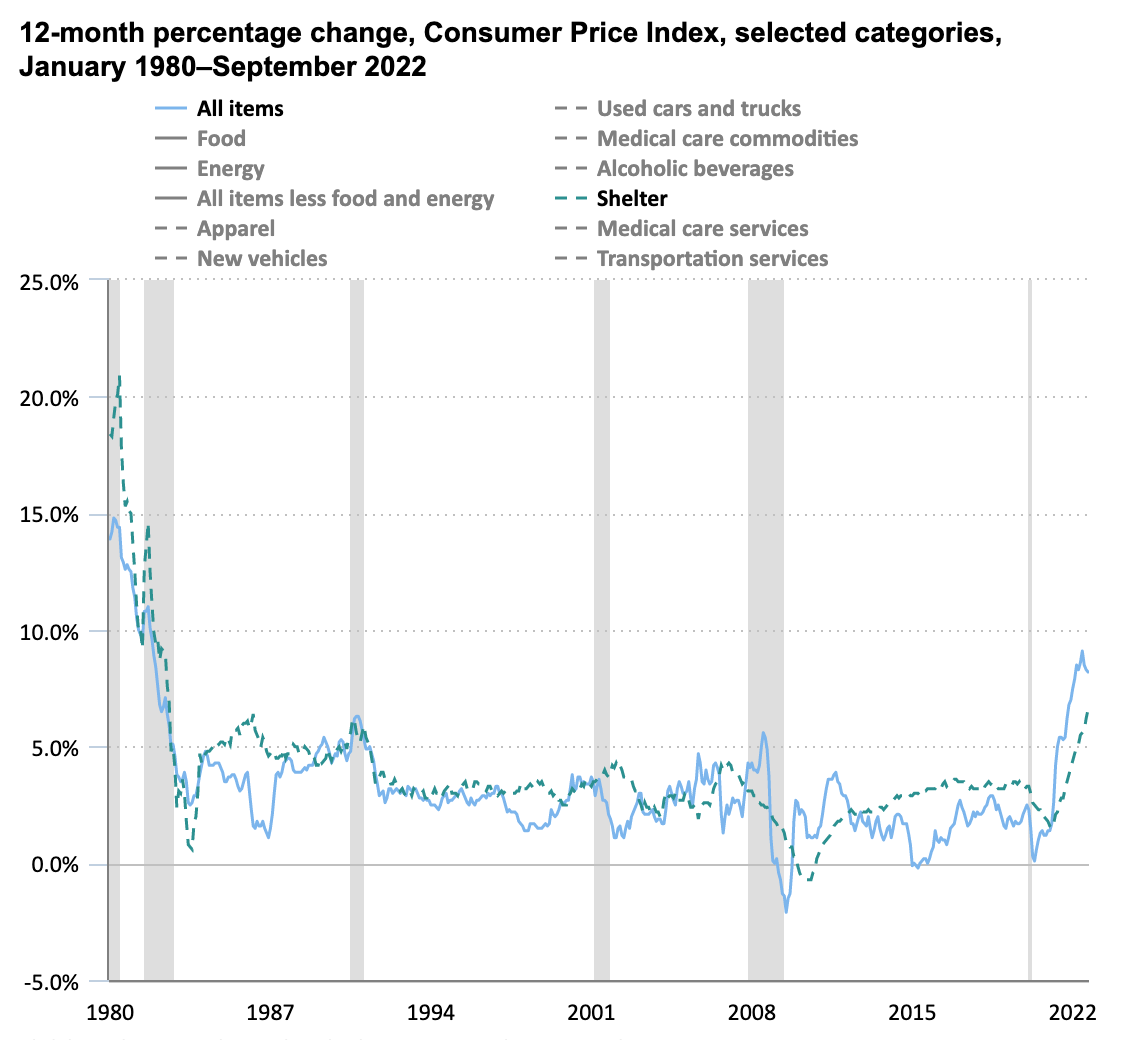
The inflation statistic we hear so much about is the Consumer Price Index (CPI), he says.
The CPI compares prices for household goods and services "to what they were one year ago today. It's an average," Toma says. "It doesn't cover all products and services. It focuses on what households typically spend their income on."
Older readers might remember how the Nielsen TV ratings were once compiled: People literally filled out little diaries, on paper, about which shows they watched and for how long.
"The U.S. Bureau of Labor Statistics surveys individuals to find out what they're buying. It's literally a journal of their purchases. It collects prices of goods and services that are directly relevant to the consumer," Toma says.
The list of goods and services surveyed, he says, "changes slowly. The list isn't updated every year. It's closer to every ten years."
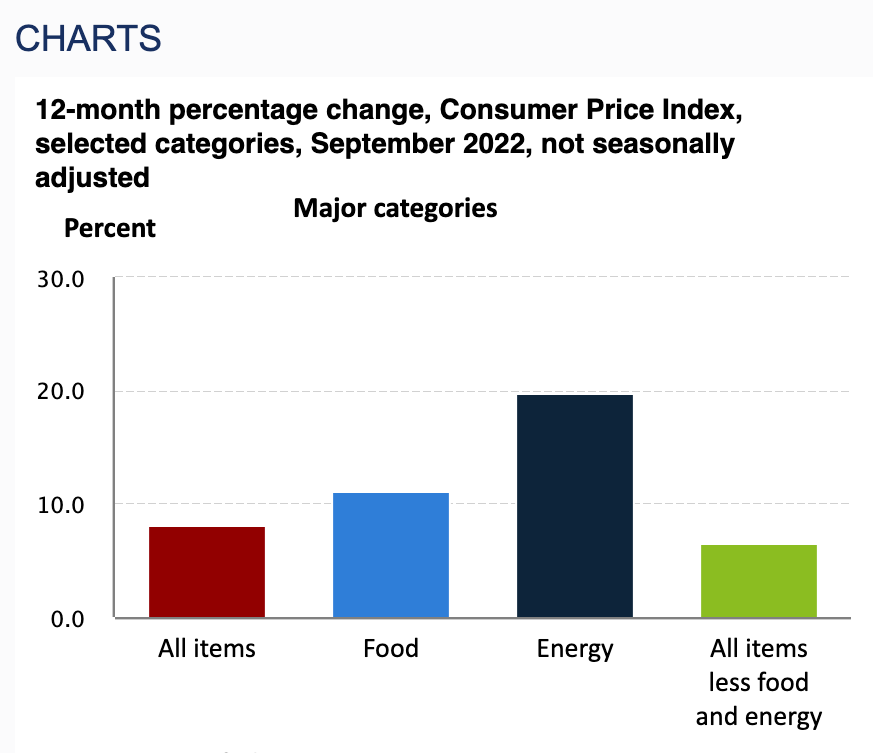
As of this writing, the CPI stands at 8.2 percent – in other words, the price of the "market basket" of goods and services measured is 8.2 percent higher than this point one year ago.
Some items can show higher increases than others – for example, energy costs are currently running a good deal higher than that 8.2 percent figure. The CPI is an average of all of the prices measured.
How about just gas prices? Some analysts say a president's approval rating, for example, is almost entirely dependent on gas prices.
Toma, however, says "Gas prices are an overly simplistic way to analyze it."
Toma, who is quick to say that he likes to "stay in his lane" and focus much more on economics than political science, says the most widely respected model for predicting elections based on economic measures is the so-called Fair Model -- which is actually named for the Yale economics professor who came up with it, not for any of its characteristics.
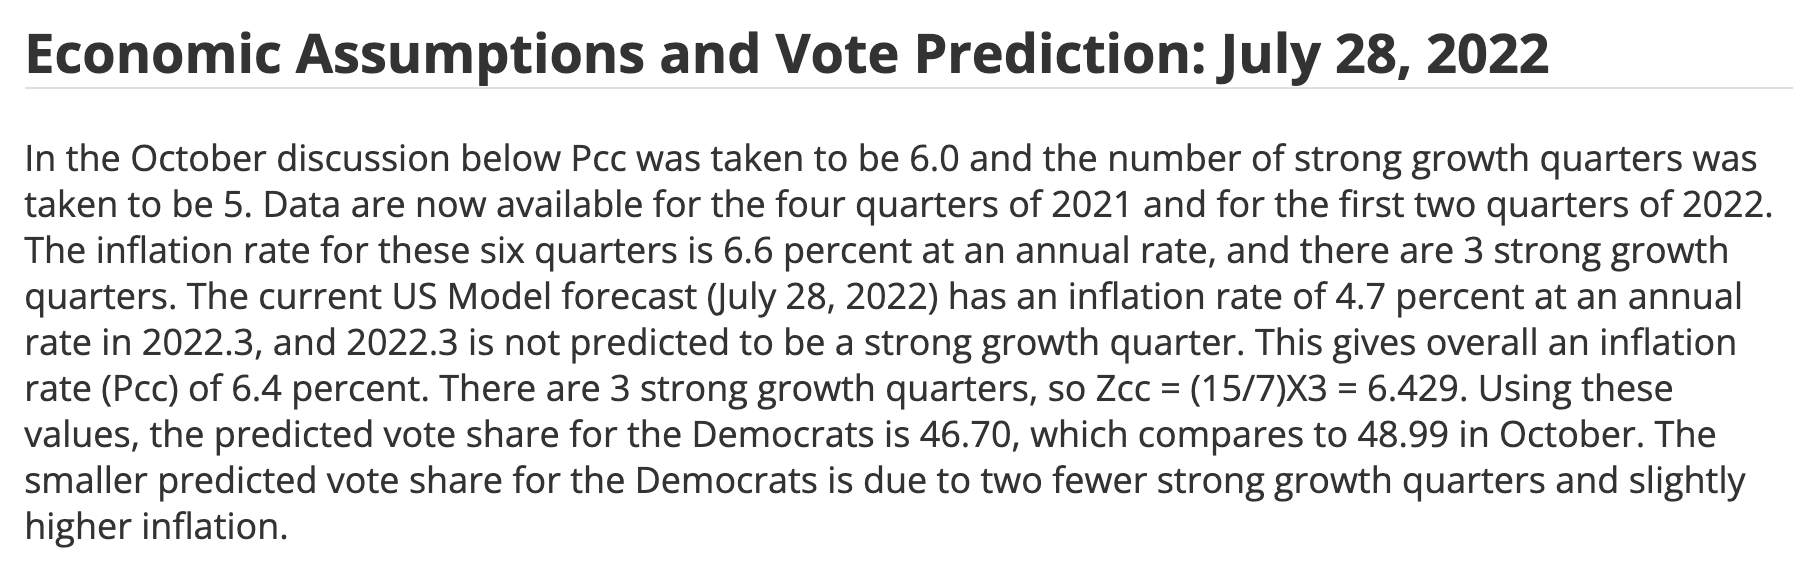
Prof. Ray Fair came up with the model in the late 1970s to predict presidential elections based mostly on economic data. The Fair model specifically predicts the total percentage of nationwide vote share that the Democratic Party will receive in any particular election, using a variety of economic variables.
The most recent running of the Fair model for the U.S. midterm election shows that Democrats can be expected to receive only 46.7 percent of the national vote share, with a margin for error of 3 percent. So even with the maximum possible error, that puts Democrats under the 50 percent mark of total votes.
It works like this:
"The model projects the vote share that Democrats receive based on two main variables," Toma explains. "For each one percent of inflation, the Democratic share of the vote goes down half a percent. For example, 6 percent inflation would result in a 3 percent reduction in Democratic vote share."
But that can be offset by strong economic growth -- the second of the two main variables.
"In this model, that's measured by the number of quarters in which GDP growth exceeded 3.2 percent," Toma says. "You take the number of those quarters and multiply by one. So if you have 3 quarters of strong economic growth, that adds 3 points to the Democratic vote share."
Long story short, Toma says, that means "for each 2 percent of inflation, Democrats need at least one quarter of strong economic growth."
But what does that mean to Georgia elections in particular?
"You have to be very careful trying to apply a nationwide model to Georgia," Toma cautions. "Georgia's economy has outperformed the national economy. I would always caution trying to extrapolate Georgia results from national data. Also, Georgia's polity is simply different from the U.S. as a whole."
One assumes -- allowing that the Fair model doesn't include state-level races in its scope -- that Georgia's comparatively robust economy might further favor incumbent Gov. Brian Kemp. But as Toma says, you can't know for sure based just on economic indicators alone.
How about skyrocketing mortgage rates and collapsing home prices? Those are two developments very few analysts saw coming even just a few months ago, when home prices seemingly had no ceiling.
"The thing is, it's not accurate to say that housing prices are falling off a cliff, or anything like that. It's more accurate to say that the rate of appreciation is slowing. Most housing is still selling for higher than its previous purchase price," Toma says.
In other words, it's all relative. Home prices and housing costs remain very high, even if they're off their peak.
As for the effect on an election, Toma says, "That kind of thing is more baked in. It's based on mortgage rates and terms of loans that are essentially fixed."
Also, there are simply far fewer people involved in the buying and selling of real estate. "But almost everybody has to go to the grocery store and the gas station just about every week. That's top of mind," Toma concludes.